BigCharts has been around for ages. It’s popular for people who love tracking stock prices, analyzing trends, and checking historical charts. It’s kind of like an old, reliable calculator—but for stocks. But let’s be honest, BigCharts is looking a bit outdated these days. If you’re searching for a modern, fun, and simple alternative, look no further!
Let’s explore some cool stock charting and screening tools that are easy to understand. Your portfolio will thank you later!
1. TradingView – The Cool Kid on the Block
TradingView is like a fancy smartphone compared to BigCharts’ rotary phone. It’s colorful, responsive, and very user-friendly.
- Live charts with beautiful customization
- Awesome drawing tools to mark trends, spots, and resistance levels
- Amazing community that shares trading ideas
- Screener to find stocks based on your strategy
It’s free to start, but power users may want to upgrade. Honestly, even the free version is more than enough for casual traders.
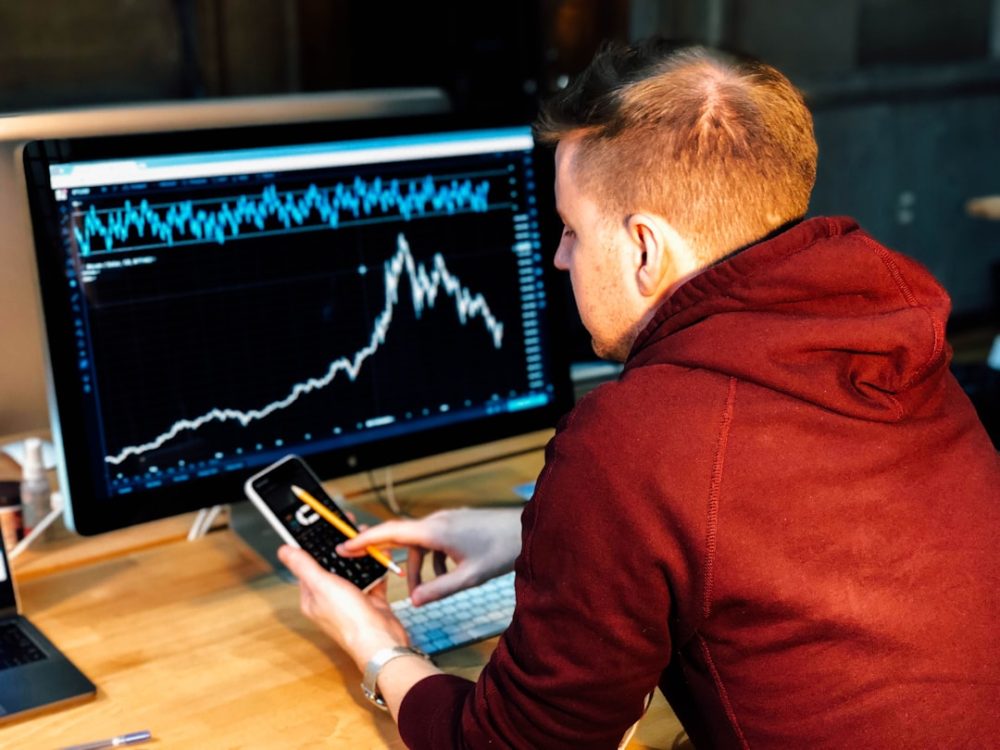
[ai-img]trading screen, finance app, stock charts[/ai-img]
2. Finviz – A Screener with Style
Finviz (short for Financial Visualizations) is a real gem. It may not be the flashiest, but it gets the job done perfectly.
- Heat maps that show market movement visually
- Fundamental and technical filters galore
- Clean charts that are super fast to load
- Pre-set screeners for different investor types
Want to find dividend stocks with low P/E ratios? Easy. Finviz has you covered. The free version has ads, but the Pro version removes them and adds real-time features.
3. Yahoo Finance – The Classic Getaway
Yahoo Finance is the Swiss Army knife of stock research. It’s got a little bit of everything.
- Interactive charts with timeframes and overlays
- Basic screeners for value, growth, or tech stocks
- Real-time news and portfolio management
If you’re new to stock investing, this could be a good beginner option. While the screener is basic, it’s perfect if you’re just dipping your toes in the ocean of investing.
[ai-img]stock market, finance news, yahoo finance[/ai-img]
4. StockCharts.com – For the Chart Lovers
This one’s for the chart nerds (we say that with love!). StockCharts.com offers deep charting features and fantastic technical analysis options.
- Candlestick patterns and overlays
- Indicators galore like RSI, MACD, moving averages
- Custom dashboards to track your watchlists
The design could use a fresh coat of paint, but under the hood, it’s powerful. Premium users get a lot more customization too.
5. Seeking Alpha – The Research Pro
While not known for charting, Seeking Alpha is unbeatable for stock research and screening.
- Quant ratings based on value, growth, and momentum
- Expert articles and analysis from investors and pros
- Screeners that are data-driven and highly detailed
If you want to dig deeper into a company and know the “why” behind stock moves, this is your playground.
Why Move On from BigCharts?
BigCharts may still work for basic charting and browsing old markets, but it’s like driving a flip phone in a Tesla world. Here are a few reasons to consider alternatives:
- Better user interfaces today
- Far more features and filters
- Updated data in real time
- Mobile apps with cool alerts and notifications
Switching to a new tool may feel strange at first. But you’ll never want to go back once you see the difference.
The Final Chart
There are many fish in the stock-charting sea. Here’s a quick cheat sheet to help you choose:
- Want Interactive Charts? Go for TradingView
- Love Heat Maps? Try Finviz
- Need News with Charts? Use Yahoo Finance
- Are You a Technical Guru? Dive into StockCharts.com
- Looking for Deep Analysis? Stick with Seeking Alpha
Try a few. See which one clicks. And don’t be afraid to mix and match. Your trading toolkit can have as many tools as you need!